Blazor WebAssembly: Using C3.js to Create Charts in Blazor WebAssembly Application
In this tutorial, we will see the way of creating Charts in Blazor WebAssembly by integrating with C3.js in it. Please note that, the implementation is completely my thought which I have suggested to one of my client. In this tutorial, the implementation is done g JavaScript interoperability.
One of the great features of the Blazor Application is that, it has an interoperability with JavaScript. I have already written an article on JavaScript interoperability on my blog. You can read steps of JavaScript interoperability from here. In Blazor Application, there is no default support for Charts are available. So to provide charts in Blazor some other alternatives must be planned. Recently, when I was discussing about the Blazor WebAssembly to one of my customer, he raised query on creating Charts. I demoed him and then I thought to write a small tutorial on it.
C3.js
C3.js is JavaScript library based on D3.js. This enables deeper integration of charts into the application. This is a small customizable library that is used to create charts in the application. C3.js generates charts using the generate() method. This method accepts object as an input parameter. This object consists of the properties those are used to act as a data source to generate chart, e.g. data, axis bindto, etc. using these properties the charts is generated and bind to the HTML element on the browser. You can read all details of C3.js from this link.
An Implementation
The application is implemented using Visual Studio 2022 Enterprise Preview. You can implement this application using Visual Studio 2019 with .NET 5 SDK.
Step 1: Open Visual Studio and create a new Blazor WebAssembly application. Name this application as Blazor_Charts.
Step 2: To use the C3.js in the application, download the latest source-code of C3.js from this link. Download this zip and extract it. Once you extract the zip, from the extracted folder add c3.js, d3-5.8.2.min.js and c3.css files in the wwwroot folder of the Blazor_Charts project.
Step 3: Lets create a hard-coded data to generate chart in the project. (Note: You can use API to receive data for generating chart. I have already written an article on this link for accessing API in Blazor App). In the project, add a new folder and name it as Models. In this folder add a new class file and name it as Population.cs. In this class file, add the code as shown in listing 1
using System.Collections.Generic;

namespace Blzor_Charts.Models
{
    public class Population
    {
        public string State { get; set; }
        public int Count { get; set; }
    }

    public class PopulationData : List<Population>
    {
        public PopulationData()
        {
            Add(new Population { State = "MH", Count = 34000});
            Add(new Population { State = "AP", Count = 14000 });
            Add(new Population { State = "GJ", Count = 24000 });
            Add(new Population { State = "KR", Count = 28000 });
            Add(new Population { State = "AP", Count = 26000 });
            Add(new Population { State = "PB", Count = 30000 });
            Add(new Population { State = "UP", Count = 64000 });
            Add(new Population { State = "JK", Count = 4000 });
            Add(new Population { State = "RJ", Count = 15000 });
            Add(new Population { State = "MP", Count = 64000 });
            Add(new Population { State = "TN", Count = 34000 });
            Add(new Population { State = "TS", Count = 16000 });
            Add(new Population { State = "OR", Count = 38000 });
            Add(new Population { State = "UK", Count = 14000 });
        }
    }
}
Listing 1: The Population data
Step 4: In the wwwroot, add a new JavaScript file and name it as drawChart.js. In this file, we will add code for generating chart using C3.js. The code for generating charts is provide in listing 2
function populationLineChart([]) {
    let data = [];
    let labels = [];
    // data points for chart range on Y-Axis
    data = arguments[0];
    // labels on X-Axis
    labels = arguments[1];
    var chart1 = c3.generate({
        bindto: '#population',
        data: {
            columns: [
                data
            ]
        },
        axis: {
            x: {
                type: 'category',
                categories: labels,
                label: {
                    text: 'States',
                    position: 'outer-center'
                }
            },
            y: {
                label: {
                    text: 'Population',
                    position: 'outer-center'
                }
            }
        }
    });
}

function populationBarChart([]) {
    let data = [];
    let labels = [];
    data = arguments[0];
    labels = arguments[1];
    var chart = c3.generate({
        bindto: '#population',
        data: {
            columns: [
                data
            ],
            type: 'bar'
        },
        bar: {
            width: {
                ratio: 0.5
            }

        },
        axis: {
            x: {
                type: 'category',
                categories: labels,
                 label: {
                    text: 'States',
                    position: 'outer-center'
                }
            },
            y: {
                label: {
                    text: 'Population',
                    position: 'outer-center'
                }
            }
        }
    });
}
Listing 2: The code to generate charts
  <!-- Load c3.css -->
    <link href="./c3.css" rel="stylesheet">

    <!-- Load d3.js and c3.js -->
    <script src="./d3-5.8.2.min.js" charset="utf-8"></script>
    <script src="./c3.min.js"></script>
<script src="./drawChart.js"></script>
.c1 {
    height:400px; width:800px
}
@page "/populationchart"
@using Blzor_Charts.Models
@inject IJSRuntime js
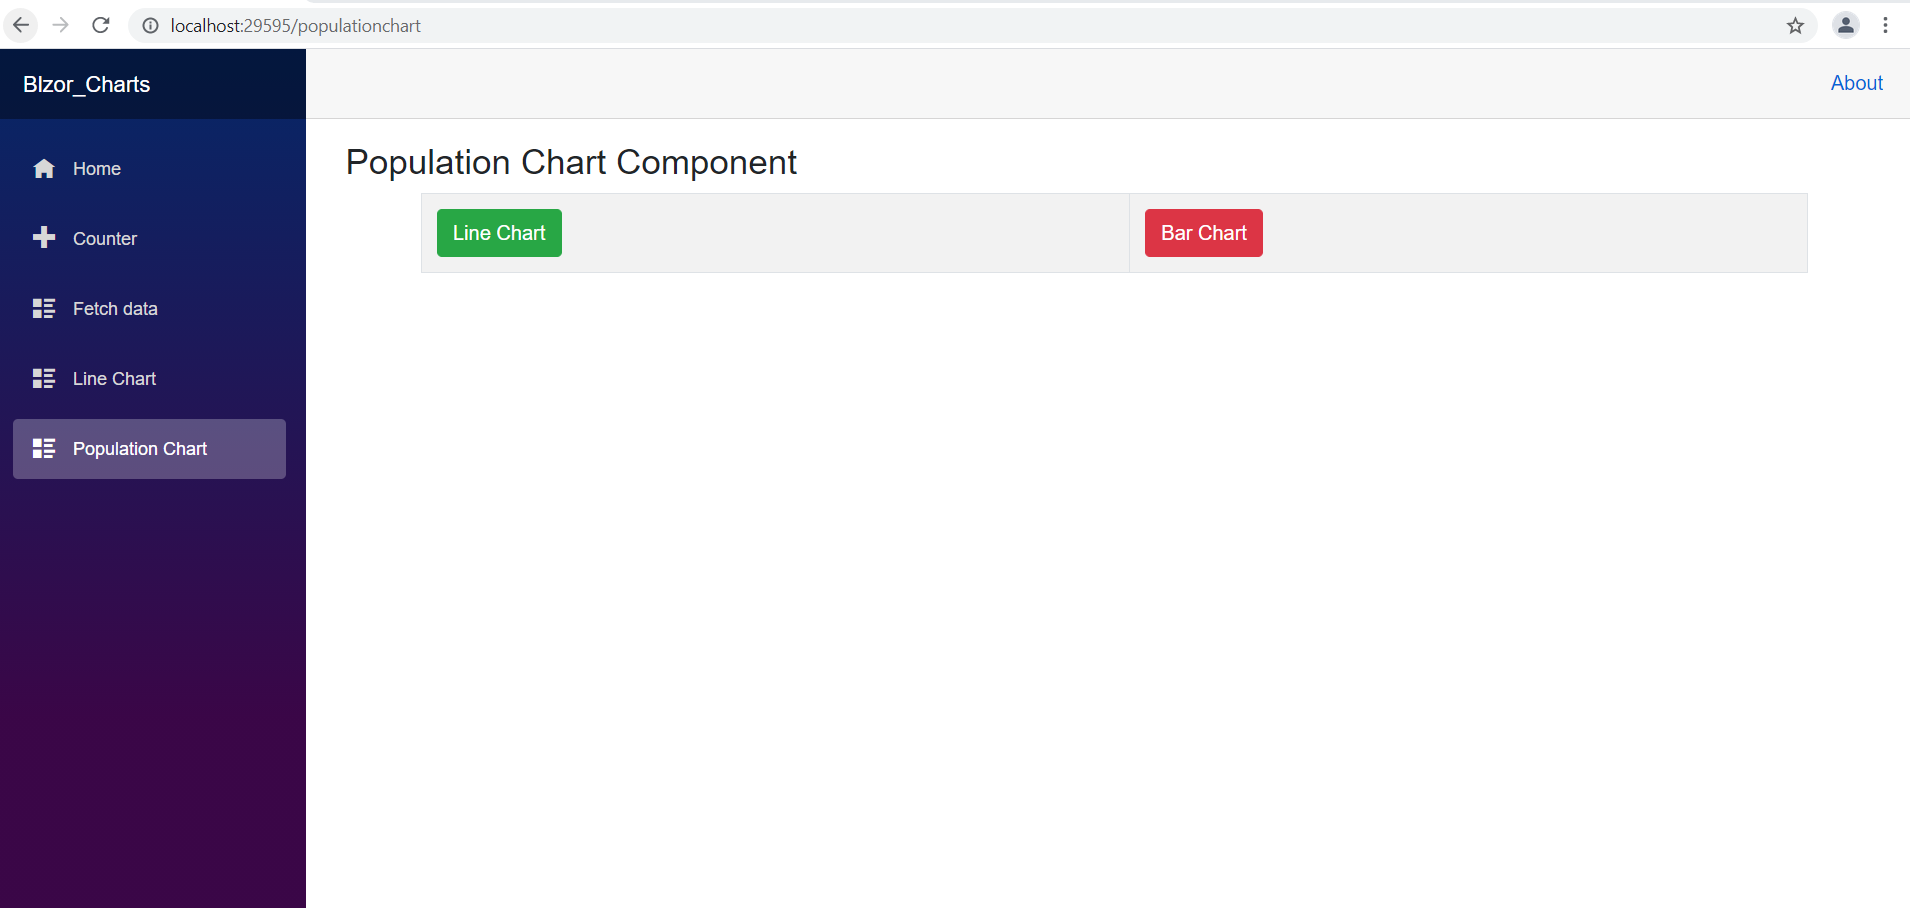
<h3>Population Chart Component</h3>

<div class="container">
    <table class="table table-bordered table-striped">
        <tbody>
            <tr>
                <td>
                    <button class="btn btn-success"
                    @onclick="@generateLineChartTask">Line Chart</button>
                </td>
                 <td>
                    <button class="btn btn-danger"
                    @onclick="@generateBarChartTask">Bar Chart</button>
                </td>
            </tr>
        </tbody>
    </table>
    <div id="population"></div>
</div>
@code {
    private PopulationData dataSource;
    private  List<string> xSource;
    private  List<int> ySource;
    private List<object> source;
    protected override Task OnInitializedAsync()
    {
        dataSource = new PopulationData();
        xSource = new List<string>();
        ySource = new List<int>();
        source = new List<object>();
        foreach (var p in dataSource)
        {
            xSource.Add(p.State);
            ySource.Add(p.Count);
        }
        source.Add(ySource);
        source.Add(xSource);
        return base.OnInitializedAsync();
    }

    async Task  generateLineChartTask()
    {
       await js.InvokeAsync<object>("populationLineChart", source.ToArray());
    }
    async Task  generateBarChartTask()
    {

       await js.InvokeAsync<object>("populationBarChart", source.ToArray());
    }
}
 <li class="nav-item px-3">
            <NavLink class="nav-link" href="populationchart">
                <span class="oi oi-list-rich" aria-hidden="true"></span> Population Chart
            </NavLink>
        </li>


